Stay up-to-date.
Would you like these weekly financial recaps personally delivered to your email inbox? Sign up here:
Human-Centric Wealth Management™


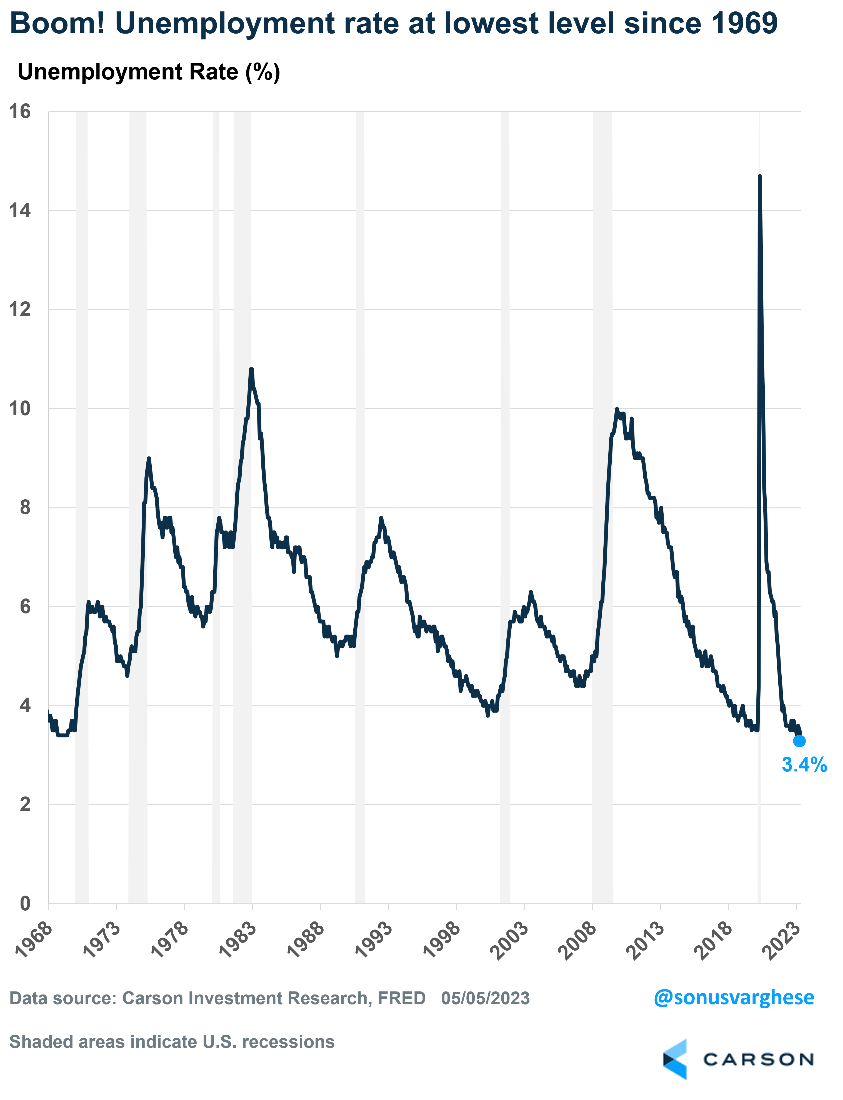
Last week, the April employment report for the United States arrived. It showed that unemployment dropped to the lowest level in more than 50 years – 3.4 percent. Other highlights included:
There were signs, however, that the labor market growth might be slowing down. The number of jobs created in February and March were both revised lower.
The Federal Reserve will be weighing the strengths and weaknesses of the labor market, as well as other data, as it makes future rate hike determinations. Last week, the Fed raised the federal funds rate from 4.83 percent to 5.08 percent, and Chair Powell suggested it could be the end of the tightening cycle, reported Jeff Cox of CNBC.
As the Federal Reserve works to rein in inflation, the labor market’s confounding durability has given central-bank officials space so far to keep interest rates in restrictive territory without having to worry about widespread layoffs or acute economic pain.
Barron’s
Last week, major U.S. stock indices finished the week with mixed performance, reported Barron’s. Yields on most U.S. Treasuries moved lower over the week.
In the face of more regional bank collapses and numerous worries about the economy, the stock market continued to hang tough. In fact, stocks have rallied late for two consecutive weeks.
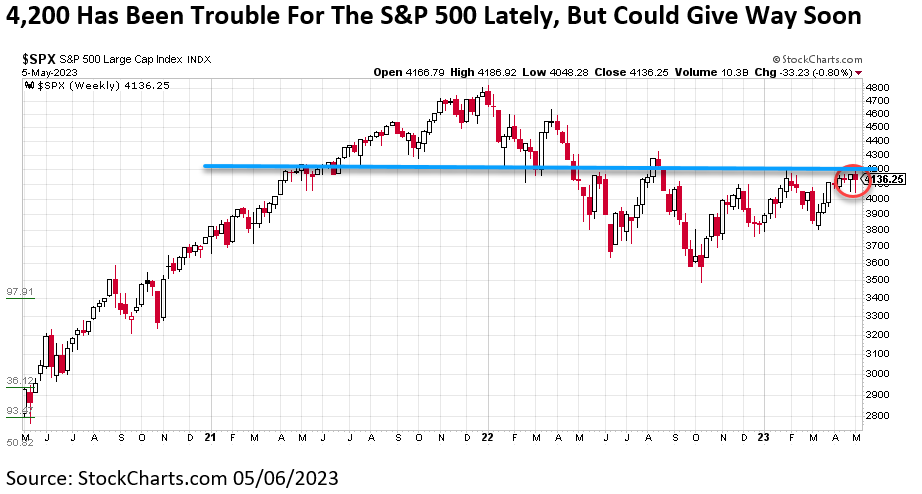
In what might come as a surprise for many investors, the S&P 500 is virtually flat over the past year. Despite countless negative events — record high inflation, a bond market crash, the most aggressive Fed policy in 40 years, the war in Ukraine, lockdowns in China, the second and third largest bank failures ever, an earnings recession, a mortgage market crash, and many more negative events — stocks are flat. Going forward, the 4,200 level on the S&P 500 is significant. As the chart below shows, this area has proved to be troublesome in the past.
Many Stocks Are Going Up
A common concern is that a handful of large stocks account for most of the stock market’s gains. This is a bearish notion as it suggests there have been weak underpinnings to the rally since October. A bull market survives with broad participation.
It has been widely reported that the largest two stocks in the S&P 500 (Microsoft and Apple) represent close to 40% of the rally this year, and the FAANG companies — Meta (formerly Facebook), Amazon, Apple, Nvidia, and Alphabet (formerly Google) — account for about 80% of the year-to-date gains.
However, this is perfectly normal. The best stocks always account for most of the gains. It’s similar to sports where the best players account for most of the points or great plays. This isn’t odd or nefarious.
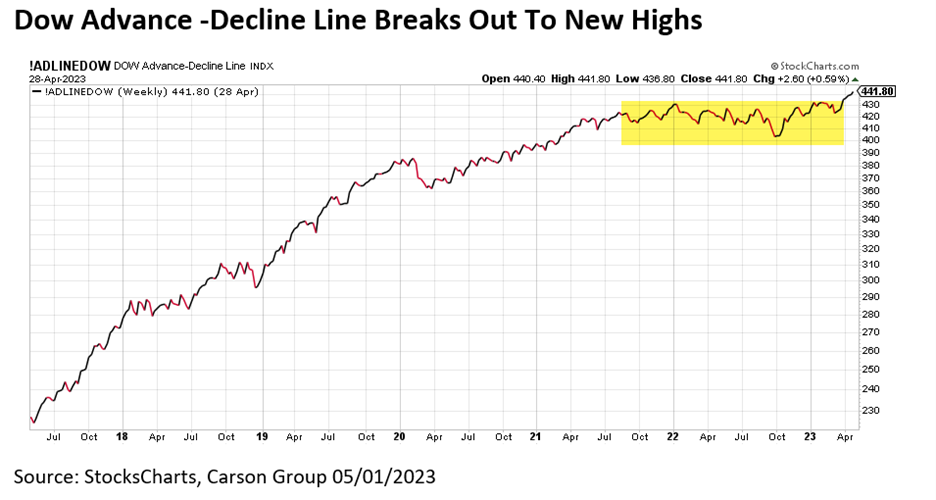
What’s the easiest way to show that more than a few stocks are rising? The advance-decline (A/D) lines is good for this purpose. An A/D line is simply a cumulative total of how many stocks went up or down each day. Throughout the market’s history, A/D lines have broken out to new highs before the indexes, while they also break down well ahead of actual price. This is one of the best ways to see what is really happening under the surface.
The Dow A/D line recently reached new highs after consolidating for more than a year. With the Dow about 6% away from new highs, this is a clue that the nearly 125-year-old index may be following the A/D line to new highs sooner than later.
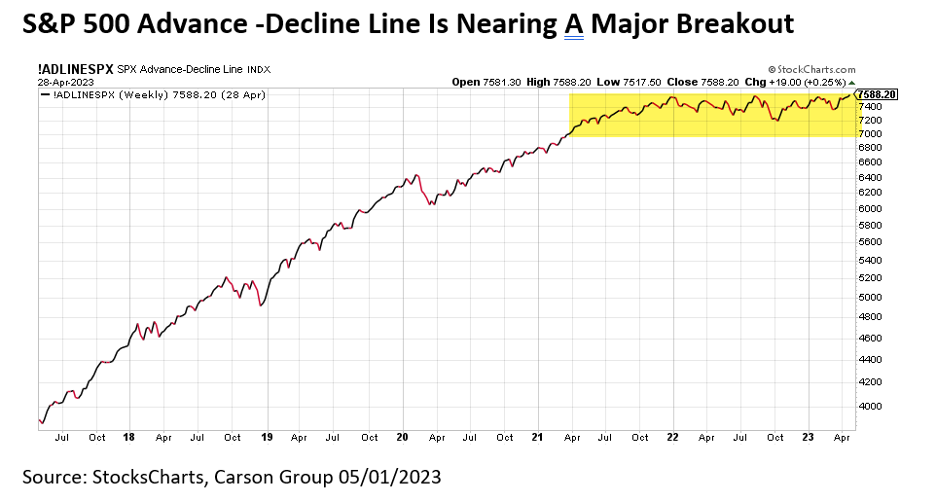
The S&P 500 A/D line shows another potentially bullish scenario. This one hasn’t quite broken out to new highs, but it is extremely close. Take note how this has trended sideways for the duration of the recent bear market, implying the tailwind for a bull market wasn’t happening. Should this break out, it could suggest continued strength through 2023 and potentially beyond.
The April employment data suggests the economy is doing just fine, and perhaps more than fine. Of course, the banking crisis is a problem. Banks are tightening credit availability, but that will likely be a slow-moving adverse force on the economy.
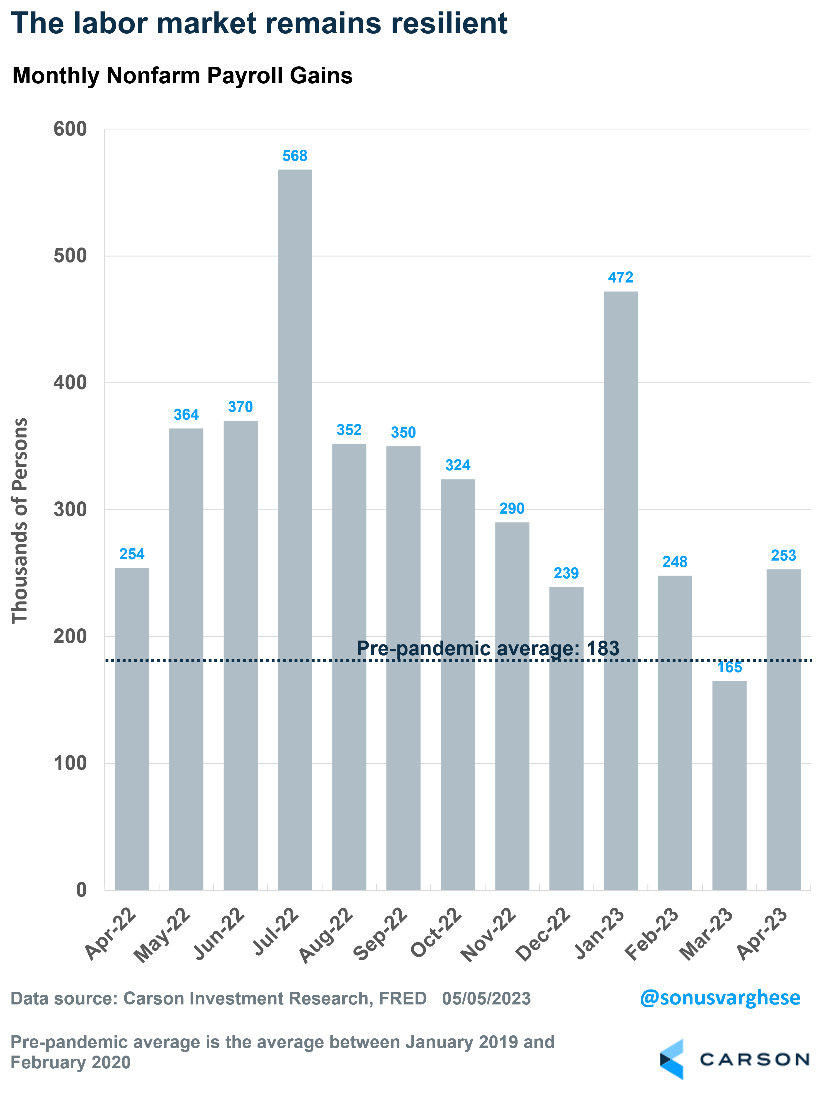
The economy created 253,000 jobs in April, well above economists’ expectations for a 179,000 increase. Payroll numbers in February and March were less than what was originally reported, as they were revised down by 149,000. So, job growth in the first quarter was slightly weaker than originally thought.
The economy has created more than 1.1 million jobs in the first four months of 2023. Even excluding January, the last three months have averaged 222,000 jobs. That’s well above the pre-pandemic average of 183,000, which was a very strong pace.
A Historically Strong Labor Market
Any skepticism of the job creation numbers washes away with the unemployment rate, which fell to 3.4%. That’s the lowest level since 1969!
What Does This Mean for the Federal Reserve?
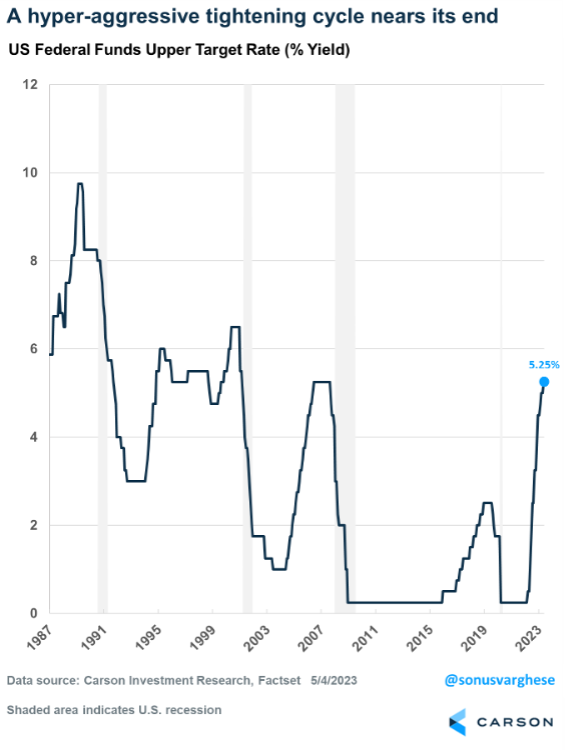
The Fed’s aggressive rate-hike campaign to fight inflation appears close to an end. The Fed has raised rates by 5%, including the latest 0.25% increase implemented last week. The federal funds rate is now in the 5-5.25% range, which was the highest point it reached during the mid-2000s economic expansion.
The rate hike in May was expected, but more welcome was the fact that the Fed didn’t think “additional policy firming may be appropriate.” While this was not an explicit signal that Fed officials are pausing, it indicated they will be more data dependent. Fed Chair Jerome Powell explicitly referenced this in his comments about the future direction of policy, saying it will be assessed based on incoming data, including employment and inflation. The Fed has done a lot — and officials believe the economy is yet to reflect the full impact.
The April payroll report suggests the labor market remains strong, which means the Fed is unlikely to cut interest rates any time soon.
Average hourly earnings accelerated in April, rising at a 5.9% annualized pace for all private workers. These numbers can be noisy, so it helps to look at an average. But even that is running high. Average hourly earnings have been growing at a 4.2% annualized pace over the past three months, and they are up 4.4% over the past year. Pretty steady, but that also means the Fed will remain concerned about inflation. In the Fed model, strong wage growth is likely to keep underlying inflation elevated.
The biggest reason that the employment picture matters is consumption makes up 70% of the economy. And consumption is driven by income. Overall income across the entire economy is dependent on three factors:
Multiplying these factors adds up to overall income growth across the U.S. economy, which is up 6.6% over the past year. It’s down from about 12% in February 2022, but still above pre-pandemic levels.
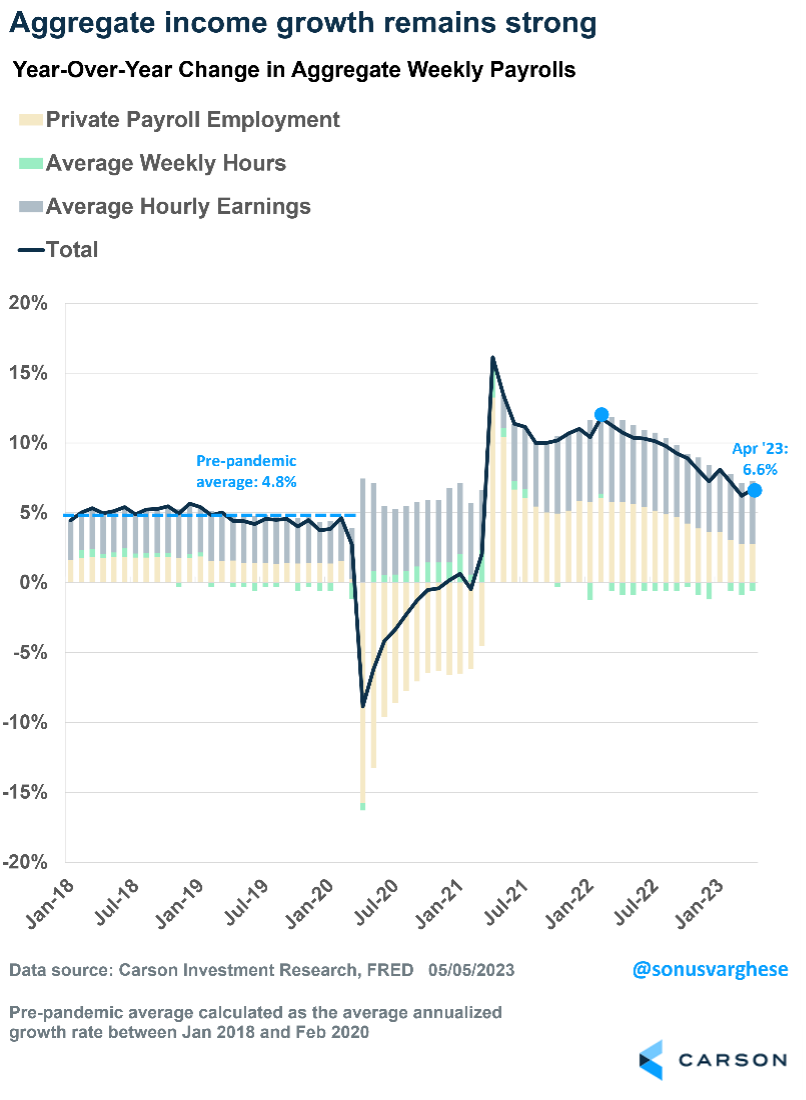
Even better news — income growth is running above inflation, which is up about 5% over the past year — and energy and food prices continue to fall. That means people have more money in their pockets, which is positive for the economy.
May 9, 1914: Woodrow Wilson Proclaims the First Mother’s Day Holiday
On May 9, 1914, President Woodrow Wilson issued a presidential proclamation that officially established the first national Mother’s Day holiday to celebrate America’s mothers.
The idea for a “Mother’s Day” is credited by some to Julia Ward Howe (1872) and by others to Anna Jarvis (1907), who both suggested a holiday dedicated to a day of peace. Many individual states celebrated Mother’s Day by 1911, but it was not until Wilson lobbied Congress in 1914 that Mother’s Day was officially set on the second Sunday of every May. In his first Mother’s Day proclamation, Wilson stated that the holiday offered a chance to “[publicly express] our love and reverence for the mothers of our country.”
Middle age is when you’ve met so many people that every new person you meet reminds you of someone else.
Ogden Nash, Poet
The love of liberty is the love of others; the love is power is the love of ourselves.
William Hazlitt, Essayist
Investment advisory services offered through SPC Financial® (SPC). *Tax services and analysis are provided by the related firm, Sella & Martinic (S&M), through a separate engagement letter with clients. SPC and S&M do not accept orders and/or instructions regarding your investment account by email, voicemail, fax or any alternative method. Transactional details do not supersede normal trade confirmations or statements.
Email through the Internet is not secure or confidential. SPC and S&M reserve the right to monitor all email. Any information provided in this message has been prepared from sources believed to be reliable, but is not guaranteed by SPC or S&M, their owners or employees, and is not a complete summary or statement of all available data necessary for making a financial decision.
Any information provided is for informational purposes only and does not constitute a recommendation. SPC and S&M, including their owners or employees may own securities mentioned in this email or options, rights, or warrants to purchase or sell these securities.
SPC does not provide tax or legal advice. Before making a legal, investment, or tax decision, contact the appropriate professional. Any tax information or advice contained in this message is confidential and subject to the Accountant/Client Privilege.
This email is intended only for the person or entity to which it is addressed and may contain confidential and/or privileged material. Any review, retransmission, dissemination, or other use of, or taking of any action in reliance upon, this information by persons or entities other than the intended recipient is prohibited. If you received this message in error, please notify the sender and delete the material from your computer immediately. SPC and S&M shall not be liable for the improper or incomplete transmission of the information contained in this communication or for any delay in its receipt or damage to your system.
Portions of this newsletter were prepared by Carson Group Coaching. Carson Group Coaching is not affiliated with SPC or S&M. The information contained in this report does not purport to be a complete description of the securities, markets, or developments referred to in this material. The information has been obtained from sources considered to be reliable, but we do not guarantee that the foregoing material is accurate or complete. Any information is not a complete summary or statement of all available data necessary for making an investment decision and does not constitute a recommendation. This information is not intended as a solicitation of an offer to buy, hold, or sell any security referred to herein. There is no assurance any of the trends mentioned will continue in the future.
Any expression of opinion is as of this date and is subject to change without notice. Opinions expressed are not intended as investment advice or to predict future performance. Economic forecasts set forth may not develop as predicted and there can be no guarantee that strategies promoted will be successful. Past performance does not guarantee future results. Investing involves risk, including loss of principal. Consult your financial professional before making any investment decision. Stock investing involves risk including loss of principal. Diversification and asset allocation do not ensure a profit or guarantee against loss. There is no assurance that any investment strategy will be successful.
The S&P 500 is an unmanaged index of 500 widely held stocks that is generally considered representative of the U.S. stock market. The Dow Jones Industrial Average (DJIA), commonly known as "The Dow" is an index used to measure the daily stock price movements of 30 large, publicly owned U.S. companies. The NASDAQ composite is an unmanaged index of securities traded on the NASDAQ system.
The MSCI ACWI (All Country World Index) is a free float-adjusted market capitalization weighted index that is designed to measure the equity market performance of developed and emerging markets. As of June 2007, the MSCI ACWI consisted of 48 country indices comprising 23 developed and 25 emerging market country indices. Bond prices and yields are subject to change based upon market conditions and availability. If bonds are sold prior to maturity, you may receive more or less than your initial investment. There is an inverse relationship between interest rate movements and fixed income prices. Generally, when interest rates rise, fixed income prices fall and when interest rates fall, fixed income prices rise.
The Bloomberg Barclays US Aggregate Bond Index is a market capitalization-weighted index, meaning the securities in the index are weighted according to the market size of each bond type. Most U.S. traded investment grade bonds are represented.
Please note, direct investment in any index is not possible. Sector investments are companies engaged in business related to a specific sector. They are subject to fierce competition and their products and services may be subject to rapid obsolescence. There are additional risks associated with investing in an individual sector, including limited diversification.
Third-party links are being provided for informational purposes only. SPC and S&M are not affiliated with and do not endorse, authorize, sponsor, verify or monitor any of the listed websites or their respective sponsors, and they are not responsible or liable for the content of any website, or the collection or use of information regarding any website's users and/or members. Links are believed to be accurate at time of dissemination, but we make no guarantee, expressed or implied, to the accuracy of the links subsequently.
This may constitute a commercial email message under the CAN-SPAM Act of 2003. If you do not wish to receive marketing or advertising related email messages from us, please click the “unsubscribe” link within this email message. You will continue to receive emails from us related to servicing your account(s).
Sources: https://www.bls.gov/news.release/empsit.nr0.htm https://www.bloomberg.com/news/articles/2023-05-05/hot-jobs-report-raises-odds-fed-keeps-rates-higher-for-longer#xj4y7vzkg https://www.barrons.com/articles/april-jobs-report-today-a004fa27?mod=hp_LEAD_1 https://www.newyorkfed.org/markets/reference-rates/effr https://www.cnbc.com/2023/05/03/fed-rate-decision-may-2023-.html https://www.barrons.com/market-data?mod=BOL_TOPNAV https://home.treasury.gov/resource-center/data-chart-center/interest-rates/TextView?type=daily_treasury_yield_curve&field_tdr_date_value_month=202305 https://www.aarp.org/research/topics/life/info-2023/2023-travel-trends.html https://www.forbes.com/advisor/credit-cards/travel-rewards/travel-trends-predictions-2023/ https://www.ustravel.org/research/monthly-travel-data-report https://www.history.com/this-day-in-history/woodrow-wilson-proclaims-the-first-mothers-day-holiday https://www.kiplinger.com/personal-finance/spending/cheapest-countries-to-travel-to; https://www.kiplinger.com/personal-finance/spending/best-places-to-visit-where-the-dollar-is-strong https://www.goodreads.com/quotes/tag/travel
Would you like these weekly financial recaps personally delivered to your email inbox? Sign up here: