Stay up-to-date.
Would you like these weekly financial recaps personally delivered to your email inbox? Sign up here:
Human-Centric Wealth Management™


While major U.S. stock indices are in positive territory year-to-date, market gains have been concentrated in just a few companies’ stocks.
Today’s five biggest stocks…have a combined market cap of about $8.7 trillion, almost 25% of the S&P 500 [capitalization (cap)] and about 3.2 times the $2.7 trillion Russell cap…What’s more, those top five stocks have returned an average of 50% in 2023, accounting for roughly 80% of the S&P 500’s 8% gain. The median stock in the index has gained less than 2%, and less than half are trading above their 200-day moving averages…The top five stocks are also expensive: They trade for an average of 31 times estimated 2024 earnings, while the index trades at 17.4 times earnings.
Al Root, Barron’s
The fact that five stocks have been driving market performance may be hurting investor sentiment, according to sources cited by Barron’s. Sentiment also has been affected by concerns about inflation, tightening credit conditions, the possibility of a recession, and the chance the U.S. may default on its debt. Investor sentiment is the way investors feel about an asset or financial market. When investors are feeling pessimistic about stocks, stock markets tend to fall. Similarly, when investors are optimistic, stock markets tend to rise.
Bank of America’s latest survey found that sentiment among global asset managers is the most bearish it has been this year. Almost two-thirds of participants think economic growth will slow this year, although a similar number anticipate a soft landing for the global economy, reported Ksenia Galouchko of Bloomberg.
Last week, the Federal Reserve signaled they may pause further rate increases at the next Fed meeting in June, which pushed major U.S. stock indices higher. The indices gave back some gains on Friday after debt-ceiling talks faltered but finished the week higher overall. The yields on most maturities of U.S. Treasuries moved the week higher.
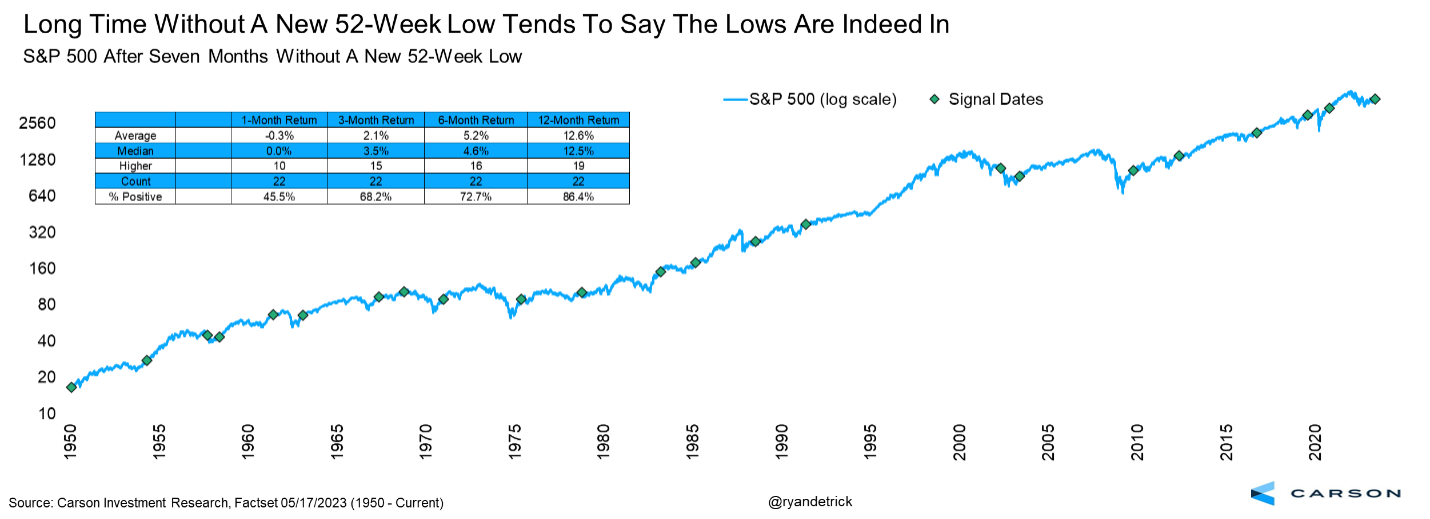
Stocks continue to trend higher in the face of a constant barrage of negative news in the media. Last Thursday the S&P 500 set another new high for 2023, up more than 9% for the year. Meanwhile, tech stocks continue to perform well, with the NASDAQ-100 setting a new 52-week high for the first time in nearly 18 months.
May marks seven months without a new low. In fact, previous times the S&P 500 made a new 52-week low (like last October) then went seven months without a new low showed strong future returns. The S&P 500 was higher one year later 19 out of 22 times and up a very solid 12.6% on average. Since 1970, stocks in this scenario made new lows only twice out of 14 times. Those new lows took place in 2002 before a generational three-year bear market and before the COVID-induced bear market and a 100-year pandemic.
The economy continues to appear strong, due primarily to:
Residential investment makes up under 5% of the economy, but it’s been a drag on economic growth for eight straight quarters. Over the four quarters through the first quarter of 2023, real GDP grew about 1.6%. But that’s after accounting for a significant 0.6-0.7% drag from residential investment.
The Federal Reserve began its most aggressive policy-tightening cycle in 40-plus years, as it attempted to curb inflation. That sent mortgage rates from 3% to 7% in less than a year, slowing the housing market. Affordability collapsed due to higher rates and elevated home prices.
Amid decreasing demand, builders reduced their involvement in new construction projects. As a result, there was a notable 27% decline in single-family construction, which comprises approximately 40% of residential investment in GDP. Brokers’ commissions, accounting for just over 20% of residential investment, experienced a 28% decrease due to a significant drop in sales activity. Home improvements also fell, primarily because many households had already completed their projects during the 2020-2021 pandemic period. The sole positive aspect within the housing sector was the continued strength in multifamily construction.
Between 1980 and 2010, the U.S. experienced five recessions, and each was preceded by a huge decline in single-family housing starts, which is a measure of construction starts on new residential units. This precedes sales of new homes as well as spending on appliances, furniture, and other home goods. It provides insight into builders’ sentiment for investing in new projects and how consumers view their personal financial situations, since buying a house a is big financial commitment.
That’s why it’s an important metric for gauging where the economy is headed.
We reviewed single-family housing starts across the five recessions that preceded the pandemic-led 2020 recession, including 1980, 1981-1982, 1990-1991, 2001, and 2007-2009. As the chart below shows, single-family starts declined significantly prior to each of those recessions, which were typically preceded by aggressive Fed tightening.
The mildest decline was in 2000, when starts declined 17%. The 1999-2000 period saw the Fed raise the federal funds rate by about 1.75%. The other periods saw rates go up by 4.0% or more.
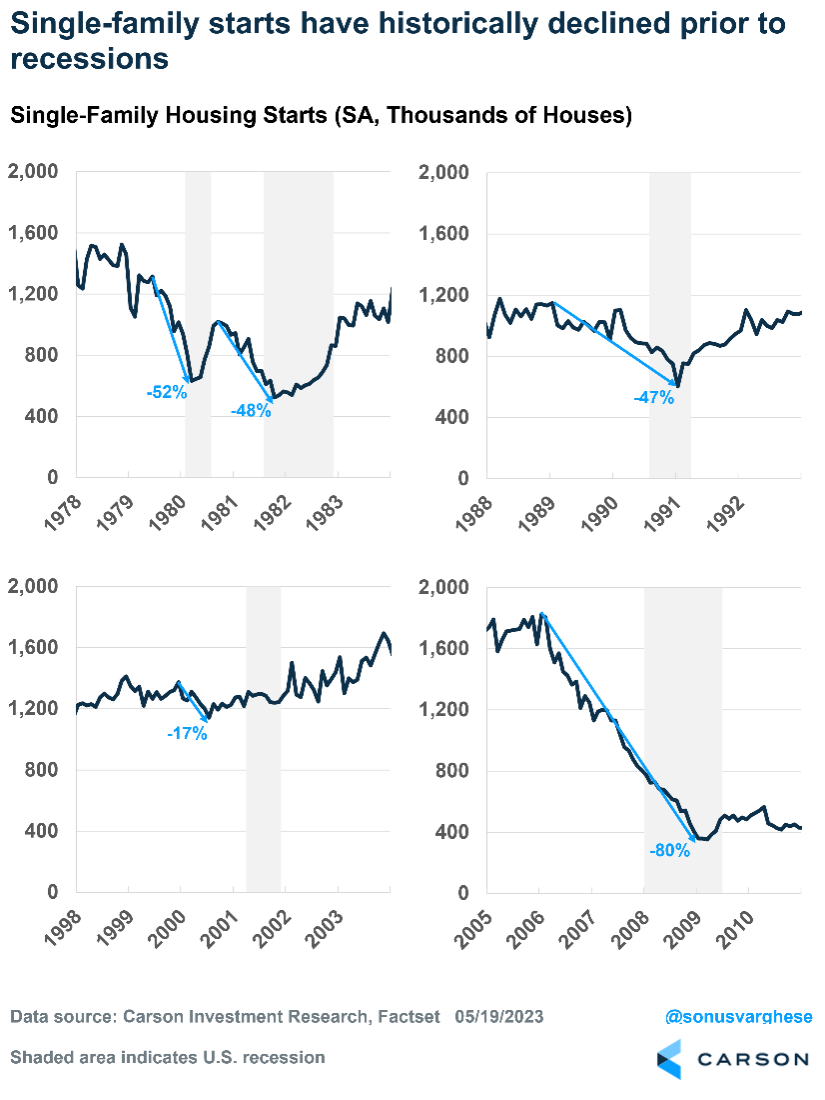
The chart also shows that housing historically bottomed prior to the end of a recession and has typically led the economy out of one. It also generally coincided with the Fed reducing interest rates in response to a slowing economy.
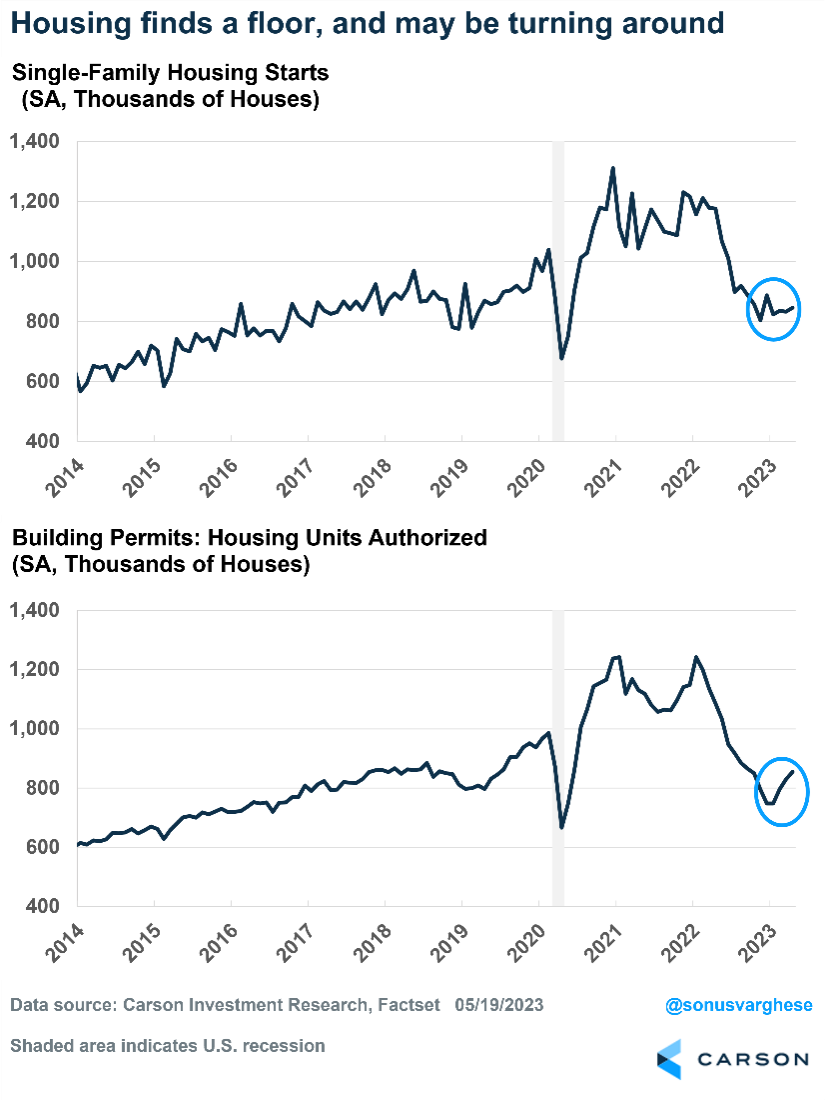
The chart below shows single-family housing starts and permits. Permits count authorized permits to build new housing units and are a leading indicator of future supply.
Thanks to aggressive Fed rate hikes, single-family starts dropped 35% over the 12 months through November 2022. Permits plunged 40% over the 11 months through December 2022.
Starts and permits appear to be turning around. Starts are up 5% since November 2022, while permits have already increased 14% over the three months through April.
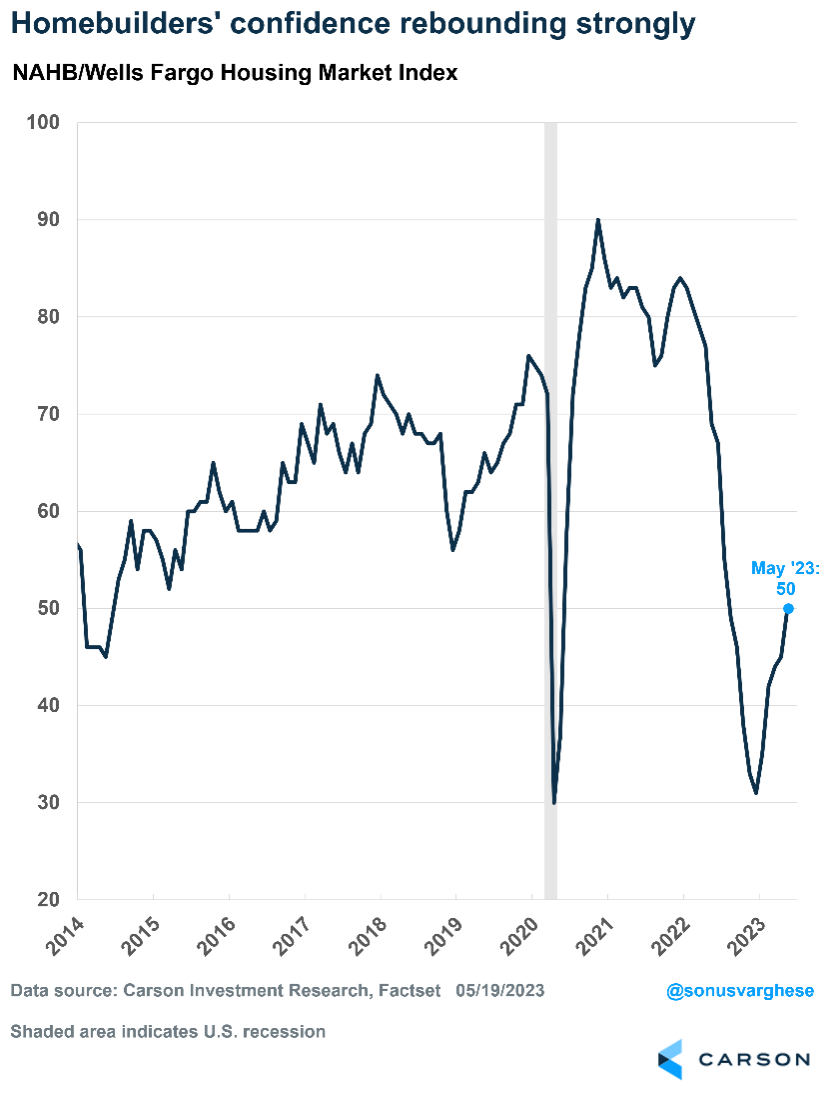
Builders Are Feeling Better About the Housing Market
Builders’ confidence in the housing market is growing. Since the start of 2023, the NAHB Housing Market Index, a gauge of builders’ confidence, has been steadily recovering. It’s still below pre-crash levels, but the upward trend is encouraging.
Due to high mortgage rates, most homeowners, who either bought their homes or refinanced at low rates, are “locked in.” So, inventory is low in the existing home sales market. However, there’s a pent-up demand due to a record number of people ages 25-34, which is prime homebuying age. These potential homebuyers are being pushed into the new homes market. That is positive for builders and the economy, since new home demand matters for economic growth.
A final point to underline this data: The SPDR S&P Homebuilders ETF, which is a basket of homebuilder stocks, just hit a new 52-week high and is at its highest level since February 2022. The ETF is up more than 19% this year through May 19. Investors are starting to treat the housing market as an early-cycle recovery story.
May 24, 1935: MLB Holds First Night Game
On May 24, 1935, the Cincinnati Reds beat the Philadelphia Phillies 2-1 in Major League Baseball’s first-ever night game, played courtesy of recently installed lights at Crosley Field in Cincinnati.
The first big league night game on this day in 1935 drew 25,000 fans, who stood by as President Roosevelt symbolically switched on the lights from Washington, D.C. To capitalize on their new evening fan base, the Reds played a night game that year against every National League team–eight games in total–and paid attendance rose 117 percent.
Though baseball owners had a well-deserved reputation for being old-fashioned, most teams soon followed suit, as they knew night games would benefit their bottom line. Teams upgraded their facilities to include lights throughout the 1930s and 40s, and before long, most of the league had night games on the schedule. Wrigley Field, on Chicago’s North Side–the second oldest major league park after Boston’s Fenway–was the last of the parks to begin hosting night games. Wrigley’s tradition of hosting only day games held for 74 seasons until August 8, 1988, when the Cubs hosted the Philadelphia Phillies. That game was rained out in the third inning, so Wrigley’s first night game is officially recorded as a 6-4 win over the New York Mets on August 9, 1988.
In my older face, I see my life. My face carries all my memories. Why should I erase them?
Diane von Furstenberg, Fashion Designer
Another word for creativity is courage.
Henri Matisse, Painter
Investment advisory services offered through SPC Financial® (SPC). *Tax services and analysis are provided by the related firm, Sella & Martinic (S&M), through a separate engagement letter with clients. SPC and S&M do not accept orders and/or instructions regarding your investment account by email, voicemail, fax or any alternative method. Transactional details do not supersede normal trade confirmations or statements.
Email through the Internet is not secure or confidential. SPC and S&M reserve the right to monitor all email. Any information provided in this message has been prepared from sources believed to be reliable, but is not guaranteed by SPC or S&M, their owners or employees, and is not a complete summary or statement of all available data necessary for making a financial decision.
Any information provided is for informational purposes only and does not constitute a recommendation. SPC and S&M, including their owners or employees may own securities mentioned in this email or options, rights, or warrants to purchase or sell these securities.
SPC does not provide tax or legal advice. Before making a legal, investment, or tax decision, contact the appropriate professional. Any tax information or advice contained in this message is confidential and subject to the Accountant/Client Privilege.
This email is intended only for the person or entity to which it is addressed and may contain confidential and/or privileged material. Any review, retransmission, dissemination, or other use of, or taking of any action in reliance upon, this information by persons or entities other than the intended recipient is prohibited. If you received this message in error, please notify the sender and delete the material from your computer immediately. SPC and S&M shall not be liable for the improper or incomplete transmission of the information contained in this communication or for any delay in its receipt or damage to your system.
Portions of this newsletter were prepared by Carson Group Coaching. Carson Group Coaching is not affiliated with SPC or S&M. The information contained in this report does not purport to be a complete description of the securities, markets, or developments referred to in this material. The information has been obtained from sources considered to be reliable, but we do not guarantee that the foregoing material is accurate or complete. Any information is not a complete summary or statement of all available data necessary for making an investment decision and does not constitute a recommendation. This information is not intended as a solicitation of an offer to buy, hold, or sell any security referred to herein. There is no assurance any of the trends mentioned will continue in the future.
Any expression of opinion is as of this date and is subject to change without notice. Opinions expressed are not intended as investment advice or to predict future performance. Economic forecasts set forth may not develop as predicted and there can be no guarantee that strategies promoted will be successful. Past performance does not guarantee future results. Investing involves risk, including loss of principal. Consult your financial professional before making any investment decision. Stock investing involves risk including loss of principal. Diversification and asset allocation do not ensure a profit or guarantee against loss. There is no assurance that any investment strategy will be successful.
The S&P 500 is an unmanaged index of 500 widely held stocks that is generally considered representative of the U.S. stock market. The Dow Jones Industrial Average (DJIA), commonly known as "The Dow" is an index used to measure the daily stock price movements of 30 large, publicly owned U.S. companies. The NASDAQ composite is an unmanaged index of securities traded on the NASDAQ system.
The MSCI ACWI (All Country World Index) is a free float-adjusted market capitalization weighted index that is designed to measure the equity market performance of developed and emerging markets. As of June 2007, the MSCI ACWI consisted of 48 country indices comprising 23 developed and 25 emerging market country indices. Bond prices and yields are subject to change based upon market conditions and availability. If bonds are sold prior to maturity, you may receive more or less than your initial investment. There is an inverse relationship between interest rate movements and fixed income prices. Generally, when interest rates rise, fixed income prices fall and when interest rates fall, fixed income prices rise.
The Bloomberg Barclays US Aggregate Bond Index is a market capitalization-weighted index, meaning the securities in the index are weighted according to the market size of each bond type. Most U.S. traded investment grade bonds are represented.
Please note, direct investment in any index is not possible. Sector investments are companies engaged in business related to a specific sector. They are subject to fierce competition and their products and services may be subject to rapid obsolescence. There are additional risks associated with investing in an individual sector, including limited diversification.
Third-party links are being provided for informational purposes only. SPC and S&M are not affiliated with and do not endorse, authorize, sponsor, verify or monitor any of the listed websites or their respective sponsors, and they are not responsible or liable for the content of any website, or the collection or use of information regarding any website's users and/or members. Links are believed to be accurate at time of dissemination, but we make no guarantee, expressed or implied, to the accuracy of the links subsequently.
This may constitute a commercial email message under the CAN-SPAM Act of 2003. If you do not wish to receive marketing or advertising related email messages from us, please click the “unsubscribe” link within this email message. You will continue to receive emails from us related to servicing your account(s).
Sources:
https://www.barrons.com/articles/the-5-stocks-that-rule-this-marketand-make-investors-nervous-be0668da
https://www.bloomberg.com/news/articles/2023-05-16/bofa-survey-shows-investors-most-pessimistic-so-far-this-year
https://corporatefinanceinstitute.com/resources/capital-markets/market-sentiment/
https://www.history.com/this-day-in-history/mlb-holds-first-night-game
https://www.cnbc.com/2023/05/19/fed-chair-powell-says-rates-may-not-have-to-rise-as-much-as-expected-to-curb-inflation.html
https://finance.yahoo.com/news/republican-debt-ceiling-negotiators-walk-155516086.html
https://home.treasury.gov/resource-center/data-chart-center/interest-rates/TextView?type=daily_treasury_yield_curve&field_tdr_date_value_month=202305
https://oceanservice.noaa.gov/facts/ninonina.html
https://www.carsonwealth.com/insights/blog/market-commentary-stocks-keep-chugging-along/?utm_source=sfmc&utm_medium=email&utm_campaign=weekly-market-commentary&j=2250356&sfmc_sub=110820205&l=380_HTML&u=31591175&mid=100016897&jb=5
https://www.science.org/doi/10.1126/science.adf2983
https://www.bloomberg.com/news/articles/2023-05-18/economic-losses-from-extreme-weather-is-severely-underestimated
https://www.goodreads.com/quotes/tag/optimism?page=3
Would you like these weekly financial recaps personally delivered to your email inbox? Sign up here: